Revenue Hub
Accelerate revenue execution
CPQ (Configure Price Quote)
Automate quotes & subscriptions
CLM (Contract Lifecycle Management)
Streamline contract signings
Billing
Manage revenue lifecycle
Subscriptions
Unlock recurring revenue

See how global events, remote work trends, migration changes, and socio-economic pressures have reshaped the Sales Operations role.

RevPath, the pathway to career success for revenue professionals, played a critical role in the research for this guide.
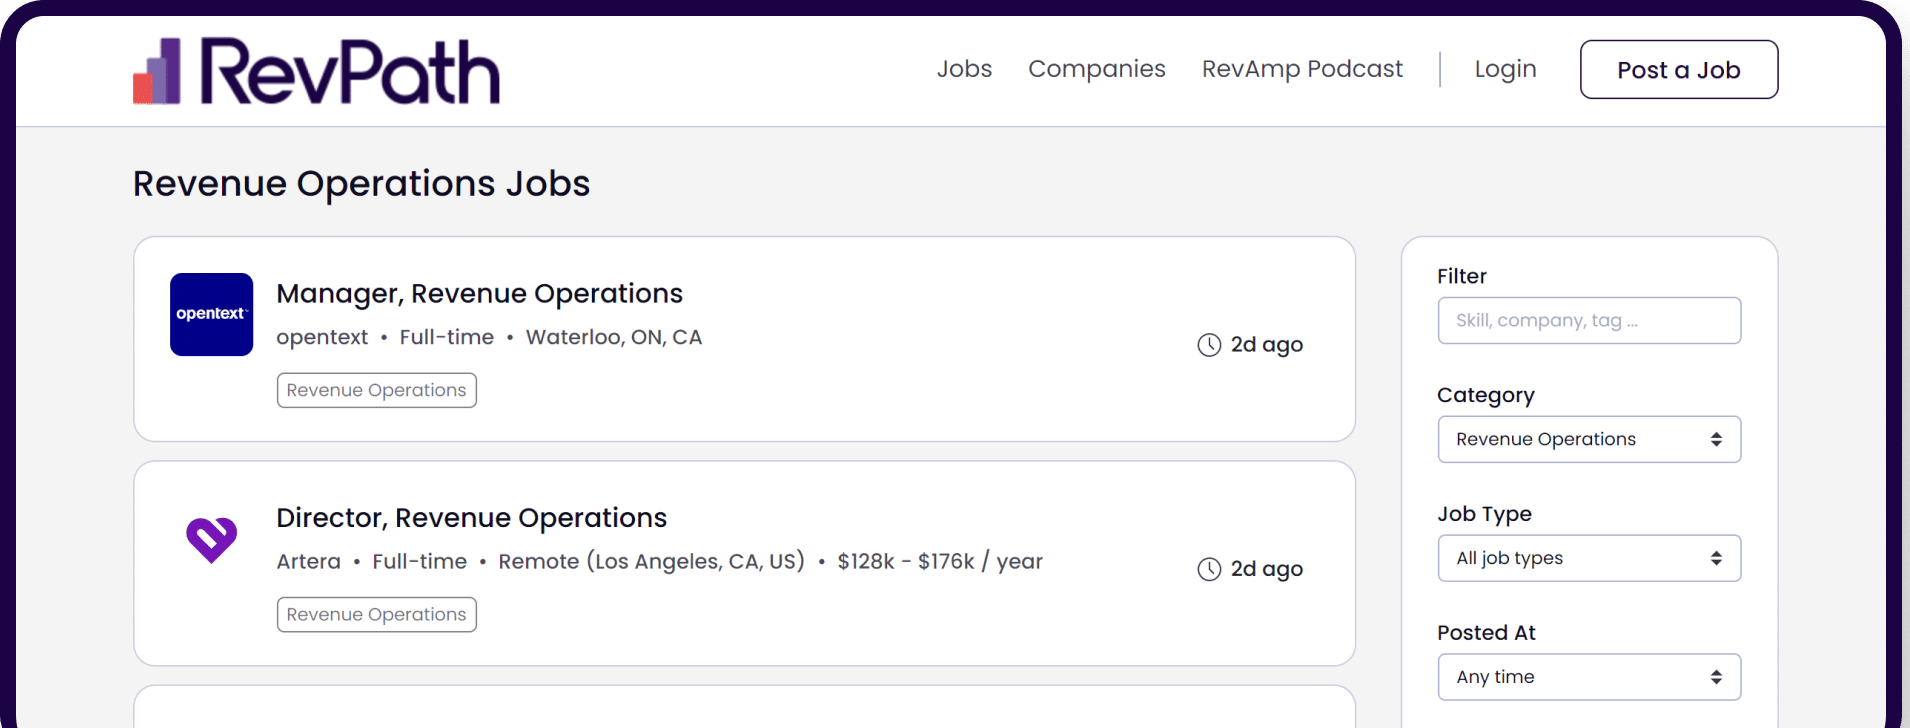
In our comprehensive analysis within this Sales Ops Salary Trends Report we leverage the insights and capabilities of RevPath.
RevPath, a cutting-edge platform known for its dynamic sales engagement and operational efficiency, plays a pivotal role in contextualizing our research findings.
By utilizing RevPath’s extensive data on sales operations and its impact on revenue generation, we are able to offer a more nuanced understanding of how salary trends correlate with sales performance and operational strategies.
This integration allows us to provide a richer, data-driven perspective on the evolving landscape of Sales Operations, highlighting not just the salary trends but also how these trends reflect in overall business performance and strategic planning in the post-pandemic era.
With RevPath’s analytics, we delve deeper into the implications of these salary trends, offering valuable insights for businesses looking to optimize their sales operations in alignment with the current market realities.

In the early months of 2020, our team at DealHub embarked on a research journey, aiming to capture a snapshot of the prevailing salary trends within Sales Operations roles across various cities.

The initial intent was to provide a comprehensive view of the current state of salaries, offering valuable insights to businesses, job seekers, and stakeholders in the industry.
However, as our research unfolded, the world was blindsided by the unprecedented impact of the COVID-19 pandemic, compelling us to shelve our findings and reevaluate our approach.
Fast forward to 2023, the employment landscape, particularly in Sales Operations, has undergone a transformative shift, influenced not only by the pandemic but also by subsequent socio-economic factors such as inflation and the widespread adoption of remote work.
This unforeseen global situation has provided us with a unique opportunity to revisit our shelved research, compare it with the current state, and explore the multifaceted trends and shifts that have occurred over these pivotal years.
This eBook, “Sales Ops Salary Trends Report,” seeks to delve into the intricate web of salary trends, exploring the disparities and growth observed in various salary ranges, the discrepancies between traditional and emerging employment hubs, and the impacts of global events on the employment market.

We will navigate through the data, comparing the pre-pandemic state in 2020 with the present in 2023, to unravel the stories and implications hidden within the numbers.

The trends we will explore are not merely statistical observations but are intertwined with employees’ lived experiences and the strategic adaptations of businesses during these tumultuous times.
From the pronounced growth in the lower end of salary ranges to the intriguing salary growth dynamics between larger, traditional employment hubs and smaller, emerging cities, our exploration is enriched and complicated by the impacts of remote work, migration patterns, and socio-economic pressures.
As we journey through this exploration, we invite you to delve into the data, contemplate the narratives, and consider the implications of these trends on the future of Sales Operations roles, salary structures, and the evolving landscape of employment.
Through a lens that is both retrospective and forward-looking, this eBook aims to provide a holistic, data-driven view, offering insights and sparking discussions about the future trajectory of salaries in Sales Operations across various geographical landscapes.
In the bustling corridors of businesses worldwide, the role of Sales Operations has quietly but significantly evolved, becoming a linchpin that ensures the sales team’s seamless functioning and strategic alignment with the overarching organizational goals.
In early 2020, DealHub initiated a research project to dissect the salary structures within this pivotal role across various cities, intending to shed light on the prevailing trends and provide a benchmark for businesses and professionals alike.
The initial research, conducted in 2020, was poised to offer a detailed view of the then-current state of salaries for Sales Operations roles.
From bustling metropolises like New York, NY, and San Francisco, CA, to emerging hubs like Atlanta, GA, and Minneapolis St. Paul, MN, the data encapsulated a wide spectrum of cities, each with its unique economic dynamics and employment landscapes.
For instance, a Sales Operations Manager with 2 years of experience in Atlanta, GA, could expect a salary of $55,000 on the lower end and $100,000 on the higher end in 2020.
Meanwhile, their counterparts in larger, traditionally recognized hubs like New York, NY, were navigating a slightly different terrain, with the lower end at $66,000 and the higher end at $120,000 for the same role and experience level (Graph 1).
2020 Salary Range Comparison for Sales Operations Manager

However, as the research was on the brink of being unveiled, the world was gripped by the unforeseen and unparalleled impacts of the COVID-19 pandemic. Economies contracted, businesses pivoted or perished, and the very essence of ‘work’ underwent a seismic shift.
The pandemic disrupted the global economy and instigated a mass reevaluation of work structures, catalyzing the adoption of remote work and altering the geographical preferences of the workforce.
The pandemic also highlighted the stark realities and vulnerabilities of income disparities.
With millions facing job losses and economic hardships, discussions around equitable pay, especially in cities with skyrocketing living costs, permeated the corporate world. The subsequent inflation and socio-economic pressures further complicated the salary structures, necessitating a revisit of the shelved research.

Ops talent is truly everywhere, not just in traditional hubs like NYC or SF, and this report proves that.
Matt Volm,
Co-Founder and CEO @ RevOps Co-op

As we stand in 2023, we find ourselves navigating through a significantly altered employment and economic landscape.
The data from 2020 serves not just as a snapshot of the pre-pandemic state but also as a poignant reminder of the transience of economic trends. The current state, shaped by numerous factors, including the pandemic, inflation, and the normalization of remote work, presents a fascinating contrast.
For example, the same Sales Operations Manager role in Atlanta, GA, now witnesses a lower-end salary of $89,000 and a higher-end salary of $139,000, marking a substantial growth of 61.82% and 39.00%, respectively (Graph 2).
While varying in magnitude, this trend is echoed across various cities and roles, presenting a rich tapestry of data to explore and understand. In the following chapters, we will delve deeper into these trends, exploring the disparities, growth, and potential driving factors behind the observed changes in the salary structures of Sales Operations roles. From the pronounced growth in entry-level salaries to the intriguing dynamics between traditional and emerging employment hubs, we will traverse through the data, unraveling the stories and implications embedded within.
Salary Growth for Sales
Operations Manager in Atlanta from 2020 to 2023


In the realm of Sales Operations, the salary structures have always been a reflection of not just the market demand and supply of skilled professionals but also the socio-economic dynamics of the geographical locations in which they operate.
As we delve into the data from 2020 and 2023, myriad trends, disparities, and growth patterns emerge, painting a nuanced picture of the shifts that have transpired over these transformative years.
The data presents a compelling narrative of salary evolution across various cities in the United States. For instance, in Atlanta, GA, the lower-end salary for a Sales Operations Manager with 2 years of experience witnessed a substantial growth of 61.82%, increasing from $55,000 in 2020 to $89,000 in 2023 (graph 3).
Similarly, the upper-end salary in the same category experienced a 39.00% growth, moving from $100,000 to $139,000 over the same period (Graph 3).
This growth pattern, albeit with variations in magnitude, is echoed across various roles and cities.
For example, in Minneapolis – St. Paul, MN, a Sales Operations Director with 7 years of experience saw a remarkable 76.32% growth in the lower-end salary, moving from $76,000 in 2020 to $134,000 in 2023, and a 68.50% growth in the upper-end, from $127,000 to $214,000 (Graph 4).
Salary Growth for Sales
Operations Manager in Atlanta from 2020 to 2023

Salary Growth for Sales Operations Director
in Minneapolis from 2020 to 2023
Director with 7 years of experience
Overall
Salary Growth
The data reveals a pervasive trend of salary growth across almost all cities and roles. However, the average growth rate for the lower-end salaries across all roles and cities is 48.92%, while the upper-end salaries experienced an average growth of 27.31%.


Disparity in Lower vs.
Upper Range Growth
A notable observation is the pronounced growth in the lower end of salary ranges compared to the upper end across multiple cities and roles. This suggests a more aggressive adjustment for entry-level or junior positions, potentially reflecting efforts to attract talent and ensure competitive starting salaries.
Traditional Hubs
vs. Emerging Hubs
Traditional employment hubs like New York, NY, and San Francisco, CA, exhibited more modest growth than emerging hubs like Atlanta, GA, and Minneapolis St. Paul, MN. For example, in San Francisco, CA, the lower-end salary for a Sales Operations Manager with 2 years of experience grew by 40.00%, while in Atlanta, GA, it grew by 61.82%.


Consistency
in Some Cities
Some cities exhibited balanced growth across both the lower and upper salary ranges, indicating a consistent approach to salary adjustments. For instance, Minneapolis-St. Paul, MN, saw substantial growth in the lower end and a significant increase in the upper-end salary ranges, particularly for roles requiring more experience.
Key Observations
These observations provide a glimpse into the multifaceted trends and shifts that have occurred in the salary structures of Sales Operations roles across various cities.
The subsequent sections will delve deeper into these trends, exploring the potential driving factors and implications of these shifts on businesses, professionals, and the job market at large.
In the following chapters, we will further dissect these trends, explore their potential driving factors, and ponder their implications on the future of Sales Operations roles and salary structures across different geographical and economic landscapes.
Exploring salary trends in Sales Operations roles across various cities unveils a tapestry of disparities and growth, intricately woven by many factors, including experience levels, geographical locations, and the socio-economic aftermath of global events like the COVID-19 pandemic.
A meticulous analysis of the aggregate data unveils a compelling narrative regarding the discrepancy in salary growth across different experience levels.
When we juxtapose the salary growth percentages against the years of experience, a fascinating pattern emerges:


Intriguingly, roles requiring less experience (2 years) have witnessed higher salary growth than roles demanding more experience (5 or 7 years).
This trend may appear counterintuitive, challenging the conventional notion that roles requiring higher experience, which typically commence at a higher baseline, would naturally exhibit slower growth.
However, this discrepancy might be emblematic of a strategic recalibration in salary structures, potentially aimed at attracting early-career talent amidst a competitive job market and ensuring that starting salaries are competitive, equitable, and reflective of the living costs.
The divergence in salary growth between traditional employment hubs and smaller cities or rural areas is another pivotal trend.
Traditional hubs like New York, NY, and San Francisco, CA, exhibited more modest growth in salary ranges.
For example, in New York, NY, the lower-end salary for a Sales Operations Manager with 2 years of experience grew by 39.39%, while in a burgeoning hub like Atlanta, GA, it soared by 61.82%. To further illustrate this point, let’s delve into a comparison involving another emerging hub: Austin, TX (graph 10).
Lower-End Salary for
Sales Operations Manager With 2 Years of Experience

When we juxtapose the growth in Austin against traditional powerhouses like San Francisco and New York, the trend becomes even more palpable:
Salary Growth Comparison Between
Traditional and Emerging Hubs

Austin, often hailed as a burgeoning tech and business hub, has witnessed a notable surge in salary growth, outpacing traditional hubs like San Francisco and New York. This could be attributed to the decentralization of talent and opportunities, propelled by the rise of remote work and the migration of professionals to smaller cities in search of a lower cost of living and improved quality of life.
The pronounced growth at the lower end of salary ranges is a trend that permeates across various cities and roles. For instance, in Minneapolis-St. Paul, MN, the lower-end salary for a Sales Operations Director with 7 years of experience witnessed a staggering 76.32% growth, increasing from $76,000 in 2020 to $134,000 in 2023.

This substantial growth at the lower end of the salary spectrum might be reflective of efforts to ensure that salaries are competitive and provide a sustainable living wage amidst rising living costs.
Considering the broader socio-economic and organizational dynamics at play is pivotal in these trends’ context.
Moreover, the larger salary growth for less experienced workers and at the lower end of the salary range for a given role might indicate a broader shift towards reducing income disparities and promoting a more equitable and inclusive compensation structure.
In the subsequent chapters, we will delve deeper into these potential driving factors, exploring how remote work dynamics, socio-economic pressures, and the evolving business landscape might have influenced these trends, and pondering their implications on the future trajectory of Sales Operations roles and salary structures.

We are seeing the same decentralized Sales Operations role trend, and the new level of Bus Apps solutions available makes this increasingly possible.
Daryn Smith
CEO

In an era where technological advancements have unshackled work from traditional office spaces, a significant migration pattern has emerged within the workforce, especially in Sales Operations.
This chapter explores the profound impacts of remote work and the migration to smaller cities on salary trends, providing a lens through which to view the data and trends observed in the preceding chapters.
The advent of remote work has been a temporary shift and a transformative movement in the global work culture.
The data from 2020 to 2023 underscores this, revealing intriguing patterns in salary adjustments across various cities and experience levels.
The ability to work from anywhere has provided employees with the flexibility to choose their living location independently of their work location and prompted companies to recalibrate their salary structures and hiring practices.
In the context of Sales Operations roles, this has meant that companies are no longer bound by geographical constraints in sourcing talent, and professionals in the field have a more comprehensive array of opportunities, regardless of their physical location.
This has inevitably influenced salary trends, as companies navigate the complexities of attracting and retaining talent in a dispersed and competitive market.
Average Salary Growth by City

The data reveals a noteworthy trend: smaller cities or those not traditionally recognized as major employment hubs have experienced a significant uptick in salary growth.
For instance, while traditional hubs like San Francisco, CA, and New York, NY, have seen growths of 24.38% and 31.53%, respectively, emerging hubs like Austin, TX, have witnessed a growth of 37.33% (Graph 11).
This migration to smaller cities, often driven by factors such as the search for a lower cost of living and improved quality of life, has had a palpable impact on salary trends.
Companies have adjusted their salary offerings to tap into the talent pool that has dispersed across various geographical locations.
This is not merely to attract new talent but also to retain existing employees who may have relocated and can now access opportunities in the broader market due to the prevalence of remote work.
Moreover, smaller cities have become new hubs for business activities, with companies establishing secondary offices or even relocating their headquarters to tap into the local talent pool and benefit from lower operational costs.
This, in turn, has driven up demand for roles in Sales Operations, contributing to the observed salary growth.
The migration from larger cities to smaller ones, facilitated by the rise of remote work, has created a new landscape that companies must navigate.
The traditional norms governing salary structures, talent acquisition, and retention have been disrupted, necessitating a reevaluation and adaptation of strategies.
In the subsequent chapters, we will delve deeper into the implications of these trends, exploring how companies might navigate this new landscape and what the future might hold for Sales Operations roles in this evolving context.


Finally! A way for me to know where I stand compared to others in my industry!
Nick (Nico) Lafakis
RevOps Strategist

Navigating through the intricate pathways of the talent landscape in Sales Operations, the data from 2020 to 2023 unveils nuanced strategies employed by organizations to attract and retain pivotal talent amidst a transformative era.
A deeper dive into the data reveals a pronounced growth in the lower end of salary ranges, particularly for roles requiring lesser experience.
For instance, in Atlanta, GA, the lower-end salary for a Sales Operations Manager with 2 years of experience witnessed a substantial growth of 61.82%, increasing from $55,000 in 2020 to $89,000 in 2023.
Similarly, in Minneapolis St. Paul, MN, a Sales Operations Director with 7 years of experience saw a remarkable 76.32% growth in the lower-end salary, moving from $76,000 in 2020 to $134,000 in 2023 (Graph 12).
This strategic elevation in starting salaries across various cities and roles underscores a concerted effort to lure fresh talent into the Sales Operations domain.
The competitive starting salaries not only serve as a tangible incentive but also reflect a recognition of the intrinsic value and fresh perspectives newcomers bring to the organizational tableau.
Growth in the Lower End of
Salary Ranges by City

The data also sheds light on intriguing patterns that might be indicative of strategies aimed at talent retention.
For instance, while traditional hubs like San Francisco, CA,
and New York, NY, have seen growths of 24.38% and 31.53%, respectively, in the lower-end salary for a Sales Operations Manager with 2 years of experience, emerging hubs like Austin, TX, have witnessed a growth of 37.33% (Graph 13).
This suggests that more miniature cities and emerging hubs are not merely participants in
the talent game but are actively strategizing to
retain and attract talent by offering competitive and often higher salary growth than their larger counterparts.
By doing so, they retain their existing talent pool and position themselves as viable and attractive alternatives to the traditional powerhouses in the talent landscape.
Moreover, the substantial growth in the lower-end salary ranges, particularly in these emerging hubs, might also be a strategic move to enhance job satisfaction and loyalty among early-career professionals, ensuring they envision a future within the organization and thereby reducing turnover.
Salary Growth Comparison Between
Traditional and Emerging Hubs

In the multifaceted talent landscape, the strategies employed by organizations, as illuminated by the data, provide a window into the adaptive mechanisms employed to navigate the shifts and trends in the broader socio-economic and organizational contexts.
In the subsequent chapters, we will delve deeper into these mechanisms, exploring their implications and pondering the future trajectories of the Sales Operations domain amidst an evolving talent landscape.
In the intricate web of the job market, socio-economic factors weave a complex tapestry that influences salary structures and growth trends. The data from our research, spanning from 2020 to 2023, highlights the shifts in the Sales Operations domain and provides a lens through which we can observe the impacts of broader socio-economic phenomena, such as inflation and discussions around income inequality.
Inflation and living costs have been pivotal in shaping salary adjustments across various roles and cities.
According to the U.S. Bureau of Labor Statistics, the United States experienced an inflation rate of 7.0% in December 2022, the highest since 1982. This inflationary pressure has necessitated salary adjustments to ensure that employees can maintain a reasonable standard of living.
For instance, in Atlanta, GA, the lower-end salary for a Sales Operations Manager with 2 years of experience saw a remarkable increase of 61.82% from 2020 to 2023. Similarly, in Austin,
TX, the same role experienced a 54.39% increase in the lower end of the salary range (Graph 14).
Moreover, considering that a 2022 report from the Council for Community and Economic Research indicated that cities like San Francisco and New York ranked as top contenders in the most expensive U.S. cities to live in, the salary adjustments in these cities, while substantial, beg the question:
Are these increases sufficient to offset employees’ financial pressures in such locales?
Lower-End Salary for Sales Operations
Manager With 2 Years of Experience

The discourse around income inequality has gained momentum in recent years, sparking debates and prompting organizations to reevaluate their compensation structures.
The Economic Policy Institute reported in 2022 that the wage growth for high-wage workers was approximately three times that of low-wage workers over the past decade. This national trend provides a backdrop against which we can analyze the data from the Sales Operations domain.
The average growth in the lower end of the salary range across all surveyed cities and roles was 48.92%, while the upper end saw an average growth of 27.31%.
This discrepancy in growth rates between the lower and upper ends of the salary spectrum may indicate a deliberate effort to compress wage disparities and foster a more equitable compensation structure.
In Minneapolis St. Paul, MN, a Sales Operations Director with 7 years of experience witnessed a staggering 76.32% increase in the lower end of the salary range, while the upper end experienced a 68.50% increase (Graph 15).
This substantial growth, especially at the lower end, may be reflective of initiatives to mitigate income inequality within the organization.
Minneapolis Lower-End Salary for
Sales Operations Director with 7 Years of Experience

The interplay between economic pressures and ethical considerations in salary adjustments is evident.
Organizations are not only navigating the tangible impacts of inflation and living costs. Still, they also respond to the intangible yet potent influences of socioeconomic discussions and ethical considerations regarding wage disparities.
In cities like San Francisco, CA, where the cost of
living is notoriously high, the lower end of the salary range for a Sales Operations Manager with 2 years of experience saw a 40.00% increase.
This substantial adjustment also needs to be viewed in the context of the city’s exorbitant living costs, raising questions about whether such increases are sufficient to offset the financial pressures employees face in such locales.
As we delve deeper into the data and its implications, it becomes apparent that salary trends are not solely a reflection of market rates and industry benchmarks. They are also deeply intertwined with socioeconomic contexts, ethical considerations, and organizational values.
In the subsequent chapters, we will continue to explore other facets of the data, unraveling further insights and trends that have shaped the Sales Operations salary landscape from 2020 to 2023.

The ripple effects of these salary trends extend far beyond individual paychecks and company budgets. They touch upon the fabric of talent acquisition, retention strategies, and even the economic vitality of cities.
Peering into the future, we’re met with a cascade of questions and potential scenarios.
Will the surge in lower-end salaries sustain its momentum or find a new equilibrium as it nears its mid and senior-level counterparts?
How will the spatial redistribution of talent and opportunities sculpt the business landscapes of emerging hubs? And crucially, how will these shifts percolate through the layers of income disparities and socio-economic strata?
The widespread adoption of remote work has shattered traditional employment norms, offering companies and employees newfound flexibility and a broader canvas to paint their professional journeys.
This could further invigorate smaller cities, as businesses, whether through satellite offices or hybrid models, seek to harness the potential of a geographically diverse talent pool.
Efforts to bridge wage gaps and foster equitable pay structures might also intensify, shaping salary structures across various sectors and roles.
Armed with data and insights like those presented in our research, companies might find themselves recalibrating their compensation strategies to ensure they remain competitive and fair.
As we start to draw this exploration to a close, the dialogue is far from over.
The trends will continue to evolve, crafting new narratives and pathways in the dynamic realm of Sales Operations salaries.
The data serves not just as a reflection of the present but as a springboard for strategy, discussion, and navigation through the unfolding scenarios of the future.
When we at DealHub embarked on this research journey in 2020, our primary intent was to provide a snapshot of the prevailing state of salaries within Sales Operations roles.
The data was meant to serve as a benchmark, a reference point for professionals and employers navigating the compensation landscape in various cities across the United States.
However, the onset of the COVID-19 pandemic introduced a new layer of complexity and urgency to our exploration.
The pandemic disrupted lives and economies and inadvertently became a catalyst for change in the professional world. It reshaped work structures, introduced new norms, and altered geographical preferences for both employers and employees.
Our shelved research suddenly became a valuable baseline to examine the shifts and trends that emerged after these global changes.
The comparison between our initial data from 2020 and the current state in 2023 has unveiled several intriguing trends and patterns.
The pronounced growth in the lower end of salary ranges, especially in emerging hubs and among less experienced roles, pointed towards a possible strategic shift in compensation structures.
Cities like Atlanta, GA, and Minneapolis St. Paul, MN, emerged as noteworthy examples where salary growth was substantial and seemingly strategic, catering to various experience levels and roles differently.
Moreover, the migration from traditional hubs to smaller cities, propelled by the rise of remote work, has also been a significant learning point.
Conclusion
As we wrap up our exploration, it’s imperative to underscore the significance of understanding and addressing the disparities and growth within salary ranges.
The trends observed through our research journey are not merely statistical data points but reflect the evolving socio-economic and professional landscapes. They hint at underlying shifts in employer strategies, employee preferences, and broader economic influences.
The disparities and growth in salary ranges, especially at the lower end and among less experienced roles, signal a potential recalibration of value and investment in talent.
It’s a narrative that goes beyond mere compensation and seeps into talent attraction, retention, and socio-economic equity.
Our journey through the data has provided insights into the current state and left us with contemplative thoughts on the future trajectory of the Sales Operations domain and the professional world at large.
The shifts, trends, and patterns observed provide a foundation upon which future strategies, policies, and practices can be built, ensuring that they are reflective of the current state and adaptive to the evolving future.
In the wake of our findings, we ponder: How will these trends continue to evolve? How will the professional world adapt to these shifts in the long term?
And how will these adaptations, in turn, influence future trends in compensation, professional preferences, and geographical professional landscapes?
While our research provides a snapshot and offers insights into prevailing trends, the future remains a canvas yet to be painted, shaped by myriad factors, decisions, and unforeseen events.
As we step into this future, the learnings from our research journey offer a lens through which we can navigate, comprehend, and shape the evolving landscape of Sales Operations roles across the United States.

Close deals faster with one automated workflow for price quotes, contracts, subscription management and billing.
Our research was conducted through two precise data collection phases, the first in March 2020 and the second in October 2023. We rigorously applied the same search criteria across the same sources during each phase. This consistent approach ensured comparability and relevance in the data gathered over these distinct time periods.
The data for our analysis was sourced from some of the largest and most trustworthy job listing and salary estimation websites available today. These sources are renowned for their comprehensive and authoritative data, making them reliable references for our research purposes.
A critical aspect to note is the limitation regarding the exact sample size. The nature of our data sources means they do not disclose specific sample size details. However, our research indicates that approximately 400 job positions fitting our search criteria were consistently listed per month across all these sources throughout the studied time frame. This number provides a broad yet meaningful representation of the market, despite the absence of precise sample size figures.
While there are inherent limitations in the statistical robustness of our research due to these constraints, we have observed that the overarching trends in sales operations salaries remained constant across each source. This consistency bolsters our confidence in the representativeness of our analysis. We acknowledge that while our approach may not meet the highest standards of statistical rigor due to the unavailability of certain data specifics, the trends we identified are solidly grounded in a substantial and consistent dataset.
Our methodological approach, while constrained by certain limitations inherent to our data sources, has enabled us to identify and analyze key trends in sales operations salaries. We believe that the insights derived from this research provide a valuable and representative view of the current market conditions and salary dynamics in this field.
Business Insider, Builtin, PayScale, Glassdoor, Techcrunch, USAToday, RevPath.DealHub.io
